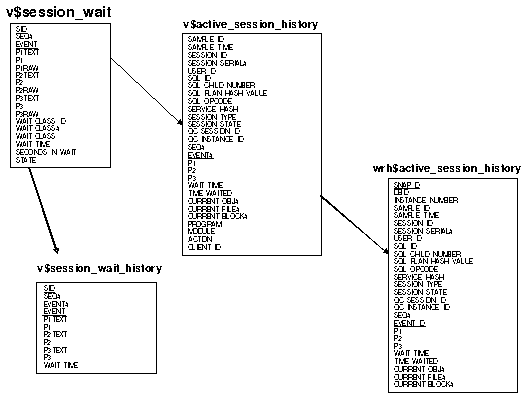
The new Oracle10g Wait Event Tables

Prior to Oraclre10g, capturing wait event information was a cumbersome process involving the setting of special events (e.g. 10046) and the reading of complex trace dumps. Fortunately, Oracle10g has simplified the way that wait event information is captured and there are a wealth of new v$ and wrh$ views relating to Oracle wait events.
Oracle10g has brand-new wait events and the database kernel now captures statistics on more than 800 specific wait events. These new wait events are the result of Oracle breaking-out their latch waits into their individual components and breaking-out enqueue waits (locks) into a finer level of granularity.
The foundation concept of the ASH architecture is called the "time model", and Oracle10g has introduced several important new wait event v$ views.
V$ View    DBA_HIST View
v$active_sess_hist  dba_hist_active_sess_history
v$sys_time_model  dba_hist_sys_time_model
v$active_session_history dba_hist_active_sess_history
v$event_histogram  No equivalent DBA view
Unlike the old-fashioned v$session and v$session_wait views (where you could only see waits at the exact instant when they occurred), the new v$session_wait_history and v$sys_time_model views allow Oracle10g to capture system waits details in a time-series mode. But wait, there's more! Now let's look at the new ASH tables structures.
What a great ASH
One of the most important area of Oracle10g wait event tuning is the Oracle10g Active Session History (ASH). ASH data is visualized through the v$active_sess_hist view and the wrh$active_session_history tables.
At a basic level, ASH stores the history of a recent session's activity and facilitates the analysis of the system performance at the current time. ASH is designed as a rolling buffer in memory, and earlier information is overwritten when needed. ASH uses the memory of the SGA.

Another new innovation is the ability to use the new Oracle10g hash key for tracking session identification. This new hash key allows you to tracks common session processes and allows inter-cal session tracking in cases like OCI session 'bouncing' where each call to Oracle is a different session ID.
As we have already noted, the ASH samples for wait events every second and tracks the waits in the new v$active_sess_hist view. New data values are written to the wrh$ tables every hour, or when a new AWR snapshot is taken. In listing 203 below we see the Oracle10g WRH$ wait event table.
wrh$_active_session_history
wrh$_active_session_history_bl
wrh$_bg_event_summary
wrh$_event_name
wrh$_metric_name
wrh$_sessmetric_history
wrh$_sys_time_model
wrh$_sys_time_model_bl
wrh$_sysmetric_history
wrh$_sysmetric_summary
wrh$_sysstat
wrh$_sysstat_bl
wrh$_system_event
wrh$_system_event_bl
wrh$_waitclassmetric_history
wrh$_waitstat
wrh$_waitstat_bl
Now, let's move away from the wrh$ tables and explore the new Oracle10g dba_hist views that are used to create time-series performance reports, both manually and within Enterprise Manager. We will begin with an overview of the dba_hist views and then show you examples of custom Oracle10g performance exception reports that can be easily generated from these views with SQL*Plus. For more details, note that these views are fully documented in the Oracle 10g Database Reference Manual.
The default collection retention for AWR data is only seven days. By using the new dbms package called dbms_workload_repository.modify_snapshot_settings., many Oracle DBAs will increase the storage of detail information over longer time periods. This will change the retention period and collection frequency, providing you with longer timer periods of data:
execute dbms_workload_repository.modify_snapshot_settings(
   interval  => 60,
   retention => 43200);
As you see, the retention period is indicated as 30 days (43200 min) while the interval between each snapshot is 60 min. You will see changes to these settings if you query the dba_hist_wr_control view after this procedure is executed.
Conclusion
Once we understand the AWR table data and inter-table relationships between AWR and performance metrics, we will be ready to understand how the WRH$ tables are used as input to the Automatic Memory Manager (AMM), the Automatic Database Diagnostic Monitor (ADDM), and the SQL Tuning Advisor.
The creation of AWR and ASH provides a complete repository for diagnosing and fixing any Oracle performance issue. The AWR provides the foundation for sophisticated performance analysis including exception reporting, trend analysis, correlation analysis, hypothesis testing and data mining.
- Donald K. Burleson's blog
- Log in to post comments

Comments
It is probably worth adding that whilst these are welcome improvements, the views that are referred to in this article form part of the Diagnostics and performance EM packs and so are an extra cost option over and above your Oracle License fee.